Chapter 16 Protein.df Revisited
In the last exercises, including the previous chapter using tidy data, we worked on the protein_df data frame as a long list, not as actual tidy data. Let’s take a look at how we can maximize the use of our tidyverse functions.
16.1 Import and Clean Data
Exercise 16.1 (Import data) Fill in the blanks to:
- Import in “Protein.txt,”
- Convert it to a tibble,
- Remove contaminants, and
- Assign it to the object
protein_df.
Use this as a template:
read.delim("___", stringsAsFactors = FALSE) %>%
  as_tibble() %>%
  filter(___ != ___) -> protein_df
16.2 Process Intensities
Exercise 16.2 Using the dplyr functions, fill in the blanks to:
- Transform all
Intensity.*columns to log10. (mutate_at()) - Do additions of the
H+MandM+Lcolumns as we have done previously, save the new columns asH.M,M.L(mutate()) - Select only the
Uniprot,H.MandM.L. (select()) - Make a tidy data set with three columns
Uniprot,RatioandIntensity(gather()) - Assign this to an object called
onlyInt
Use this as a template:
protein_df %>%
  mutate_at(vars(starts_with(___)), ___) %>%    # Calculate log10
  mutate(H.M = ___ + ___,                       # Add log10s and rename columns
         M.L = ___ + ___) %>%
  select(___, ___, ___) %>%                     # Take columns of interest
  gather(___, ___, -___) -> ___                 # gather and save
16.3 Process Ratios
Exercise 16.3 Using the dplyr functions, fill in the blanks to:
- Using the
dplyrfunctions, selectUniprotand all columns that begin withRat, but that do not end inSig. (select()) - Make a tidy data set with three columns
Uniprot,RatioandExpression(gather()) - Remove all observations where
RatioisRatio.H.L. (filter()) - Rename the levels in
Ratioto beM.LandH.M. (mutate()andrecode_factor()) - Group according to
Ratio. - Apply a transformation to log2 transform all
Expressionvalues and then shift all values to be centered on zero. (mutate()). - Assign this to
onlyRatios.
Use this as a template:
protein_df %>%
  select(Uniprot, starts_with(___), -ends_with(___)) %>%        # Calculate log2
  gather(___, ___, -___) %>%                                    # Gather
  filter(___ != ___) %>%                                        # Remove uninteresting H.L Ratio
  mutate(Ratio = recode_factor(___,                             # Relabel ratios to match the Int data frame
                               `___` = ___,
                               `___` = ___)) %>%
  group_by(___) %>%                                             # group according to ratios (2 groups)
  mutate(Expression = log2(___),                                # log2 transform
         Expression = ___ - mean(___, na.rm = T)) -> ___       # Apply shift
16.4 Process Significance Values and Merge
Exercise 16.4 Using the dplyr functions, fill in the blanks to:
- Select
Uniprotand all columns that end inSig. (select()) - Make a tidy data set with three columns
Uniprot,RatioandSignificance(gather()) - Remove all observations where
RatioisRatio.H.L. (filter()) - Rename the levels in
Ratioto beM.LandH.M. (mutate()andrecode_factor()) - In the same function, make a new variable
SigCatthat cuts up theSignificancevariable into groups according toc(-Inf, 1e-11, 1e-4, 0.05, Inf)and labels them asc("<1e-11", "<0.0001", "<0.05", "NS"). - Merge all this with the
onlyRatiosdata frame (full_join()) - Merge all this with the
onlyIntdata frame (full_join()) - Remove any incomplete observations (i.e. with an NA anywhere) and where Uniprot is empty. (
filter()andcomplete.cases(.)) - Arrange in descending order of
Significance. (arrange()anddesc()) - Assin to the object
allData
Use this as a template:
protein_df %>%
select(___, ends_with(___)) %>% # Take columns of interest
gather(___, ___, -___) %>% # Gather
filter(___ != ___) %>% # Remove uninteresting H.L Ratio
mutate(Ratio = recode_factor(___, # Relabel ratios to match the Int data frame
`___` = ___,
`___` = ___),
SigCat = cut(___, # Make colour labels for sig values
c(-Inf, 1e-11, 1e-4, 0.05, Inf),
c("<1e-11", "<0.0001", "<0.05", "NS"))) %>%
full_join(___) %>% # Merge with the log2 ratios
full_join(___) %>% # Merge with the Intensities
filter(complete.cases(.), ___ != ___) %>% # Take only observations that have complete data and non-empty Uniprot
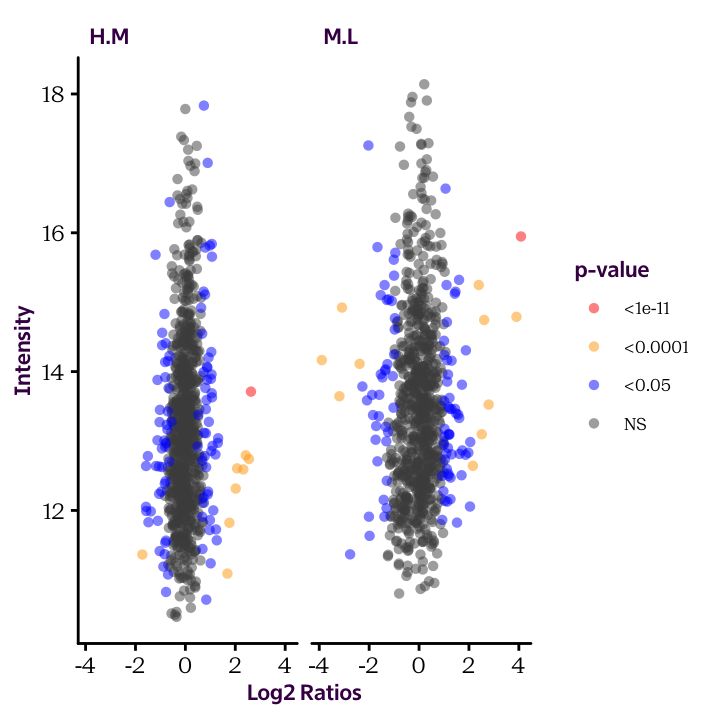
arrange(___(___)) -> ___ # Order according to sig so that low sig are plotted first16.5 Make a plot
Fill in the details to produce the following plot:
ggplot(______, aes(______, ______, col = ______)) +
  geom_point(alpha = 0.5, shape = 16) +
  scale_colour_manual(limits = c("<1e-11", "<0.0001", "<0.05", "NS"),
                      values = c("red", "orange", "blue", "grey30")) +
  facet_grid(. ~ ______) +
  labs(x = "Log2 Ratios", y = "Intensity", col = "p-value")