Chapter 8 Case-study: SILAC
Now that we’re familiar with some of the basic concepts of functional and object-oriented programming, let’s work on some real data!
8.1 Importing Data
It is likely that most of your data is found in an Excel or tab-delimited table, like the text files provided for the workshop. Use these functions to import your data and save them as a variable.
| Function | Description |
|---|---|
read.table(file) |
Read file in table format into data frame. |
read.csv(file) |
Read comma-separated data. |
read.csv2(file) |
Read semicolon-separated data. |
read.delim(file) |
Read tab-delimited data into data frame. |
read.delim2(file) |
Read tab-delimited data where the decimal place is a ,. |
The readr package, part of the tidyverse, can make things easier and faster in some cases. In particular, it doesn’t convert data types when importing (i.e. )
| Function | Description |
|---|---|
read_csv() |
Read comma-separated data. |
read_csv2() |
Read semicolon-separated data. |
read_tsv() |
Read tab-delimited data. |
read_delim() |
Reads data with any delimiter. |
The rio package (R Input/Output) offers the import() function for generic import of many different file formats.
The Protein.txt file, contains protein expression data in the form of ratios and signal intensities. There are 15 variables (i.e. columns) in the data frame. Proteins were labelled with stable isotopes of heavy or medium mass difference to the normal (low) protein mass. This leads to three ratios for each protein:
H/M- High:Medium weightM/L- Medium:Low weightH/L- High:Low weight
In addition, the intensity of each peptide, for each label, was recorded when the proteins were analysed by mass spectrometry. Individual peptide intensities have already been combined to give 3 label intensities for each protein.
Protein.txt and save it as an object called protein.df. What type of data is contained in each column?
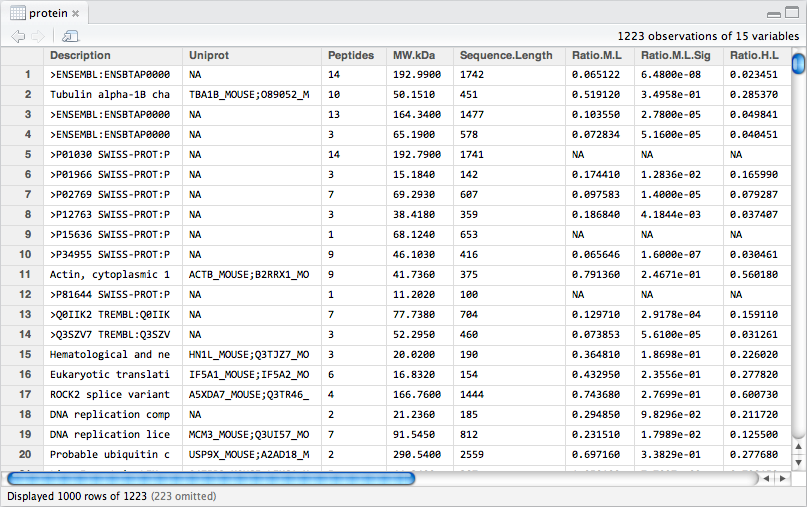
Figure 8.1: The protein.df data frame.
Typically, the first step is to clean up the data-set. In this case that would mean removing contaminants. However, we’re going to focus on applying we’re already familiary with and get to that in the next section.
Exercise 8.2 (Clean-up and Transform) There are three intensity columns, corresponding to the H, M and L labelled proteins: Intensity.H, Intensity.M and Intensity.L. Intensities are typically transformed to a \(log_{10}\) scale. Perform a \(log_{10}\) transformation on each intensity column and replace the existing columns in situ with their transformed values.
Since we're working with ratios, a protein’s intensity is actually the sum of each label's intensity. Calculate the sum of each pairwise combination of \(log_{10}\) intensities, H+M and M+L (we’re not interested in H+L), and store them in new columns called Intensity.H.M and Intensity.M.L, respectively.
Perform a \(log_2\) transformation of the ratios and store the values in situ in the same columns.
Next, confirm that protein.df has the correct dimensions, column names and information:
# [1] 1223 17# [1] -1.5105 -1.0003 -1.1532 -1.0851 NA -0.00468.2 Saving a data frame to a file
There are several ways to save an R object outside of the environment. If you have a data frame, you’re typical choice will be to write it to a file.
| Function | Description |
|---|---|
write.table(df, file) |
Save the data frame df as a file. |
write.csv(df, file) |
Save the data frame df as a comma-separated file. |
write.csv2(df, file) |
Save the data frame df as a semicolon-separated file. |
I typically use the form write.table(df, "data.txt", sep = "\t", row.names = F) to produce tab-delimited files. Alternatively, use the rio package:
| Function | Description |
|---|---|
export(df, file) |
Save the data frame df as a file. |
This will save the file type according to the file extension.