Chapter 11 Performing Statistical Tests
R is extremely powerful when it comes to performing statistical tests. Here, we will do a Pearson’s correlation between the Log2 ratios of HM and HL. The correlation test will be done with the cor.test() function, as follows:
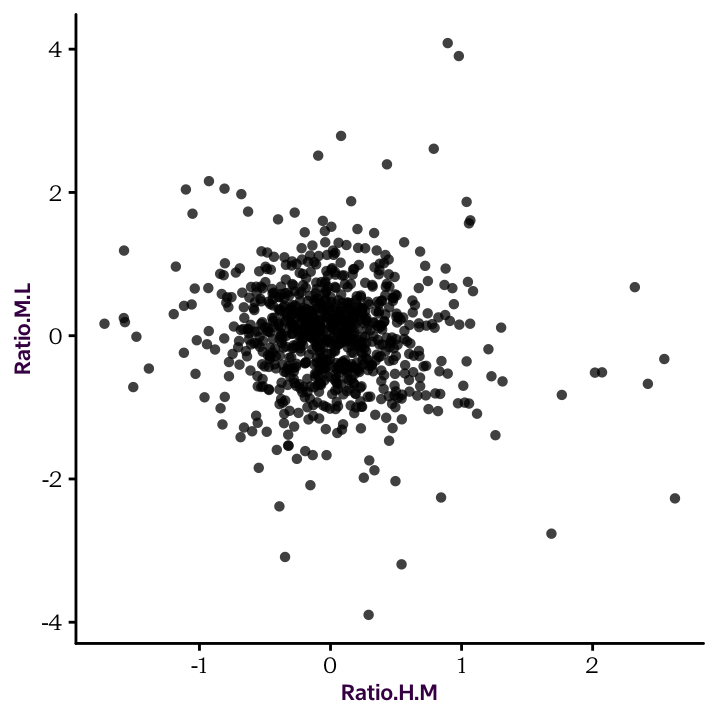
#
#   Pearson's product-moment correlation
#
# data:  protein.df$Ratio.H.M and protein.df$Ratio.M.L
# t = -3, df = 830, p-value = 0.01
# alternative hypothesis: true correlation is not equal to 0
# 95 percent confidence interval:
#  -0.156 -0.021
# sample estimates:
#    cor
# -0.089
The cor.test() function provides a set of values which can be individually accessed:
# $names
# [1] "statistic"   "parameter"   "p.value"     "estimate"
# [5] "null.value"  "alternative" "method"      "data.name"
# [9] "conf.int"
#
# $class
# [1] "htest"# [1] "htest"# [1] "statistic" "parameter" "p.value" "estimate"
# [5] "null.value" "alternative" "method" "data.name"
# [9] "conf.int"# [1] 0.01# cor
# -0.089# cor
# 0.008The class of a cor.test() output is htest (hypothesis test). htest objects are lists. They have some unique properties, but you can extract information in a similar way as in data frames.
Note that the default
cor.test()function performs a Pearson correlation coefficient. If we wanted to perform a Spearman’s rank-correlation coefficient, we would have to set themethodargument to"spearman". Also, in the output,correfers to \(R\). To calculate the more common \(R^2\), you will have to square it.↩